RESEARCH ARTICLE
Gas Hydrate Formation Phase Boundary Behaviour of Synthetic Natural Gas System of the Keta Basin of Ghana
Eric Broni-Bediako1, *, Richard Amorin1, Cornelius B. Bavoh2
Article Information
Identifiers and Pagination:
Year: 2017Volume: 10
First Page: 64
Last Page: 72
Publisher Id: TOPEJ-10-64
DOI: 10.2174/1874834101701010064
Article History:
Received Date: 16/08/2016Revision Received Date: 11/01/2017
Acceptance Date: 20/01/2017
Electronic publication date: 31/03/2017
Collection year: 2017
open-access license: This is an open access article distributed under the terms of the Creative Commons Attribution 4.0 International Public License (CC-BY 4.0), a copy of which is available at: https://creativecommons.org/licenses/by/4.0/legalcode. This license permits unrestricted use, distribution, and reproduction in any medium, provided the original author and source are credited.
Abstract
Background:
Gas hydrates are considered as a major threat to the oil and gas flow assurance industry. At high pressure and low temperature conditions, gas hydrates form in pipelines and production facilities leading to pipeline blockages, high removal cost, environmental hazards and loss of lives. For a successful prevention of gas hydrate formation, predicting the hydrate formation phase boundary of hydrocarbon fluid composition becomes very necessary.
Objective and Method:
In this study, computer simulation software called PVTSim was used to predict hydrate formation phase boundary of synthetic natural gas composition of the Keta basin of Ghana at pressure and temperature ranges of 43.09 bar - 350 bar and 12.87 °C - 27.29 °C respectively. The effect of changes in natural gas composition (N2 and H2S) and the presence of four commonly used thermodynamic gas hydrate inhibitors (methanol, ethanol, diethylene glycol and monoethylene glycol) on the hydrate formation phase boundary is also discussed. Prior to the study, the accuracy of PVTSim was validated with the hydrate formation phase data in literature.
Results and Conclusion:
Results suggested that the hydrate formation phase boundary decreased with increasing N2 composition and increased with increasing H2S composition, suggesting that, the presence of H2S increases the threat of hydrate formation. However, a reduction in hydrate formation threat was observed in the presence of all four commonly used gas hydrate thermodynamic inhibitors with methanol demonstrating the highest inhibition effect.
1. INTRODUCTION
The safe operation of oil and gas production facilities and pipelines is critical for successful oil and gas field operations. The exploration and production of oil and gas activities in deep sea operations are exposed to certain pressure and temperature condition which can lead to gas hydrate formation and severe flow assurance problems in pipelines and facilities. The major flow assurance problem faced by companies is the formation of gas hydrates. According to Xiao-Sen et al. [1] the repairs of flow assurance in the oil and gas industry amount to over US$ 200 M annually due to gas hydrate formation and aggregation. Gas hydrate plugs in pipelines do not only affect production, it also causes safety hazards due to the possibility of pressure build-up caused by the hydrate agglomeration. Since gas hydrate formation is unacceptable in the oil and gas pipelines and production facilities, their prevention becomes necessary when they are formed. Prior to hydrate prevention, the knowledge and understanding of when hydrate will form are necessary, since gas hydrate formation condition is unique to every reservoir fluid composition. The discovery of gas at the Keta basin of Ghana would be of great importance in the building of the Ghanaian economy. However, the successive flow assurance production development of the field reservoir fluid will require the knowledge on the conditions at which gas hydrate will form in the system. In this study, PVTSim (computer simulation software) was used to predict the hydrate formation phase boundary of a synthetic natural gas reservoir fluid composition of the Keta basin of Ghana at pressure and temperature ranges of 43.09 bar - 350 bar and 12.87 °C - 27.29 °C respectively. The effects of changes in natural gas composition (N2 and H2S) and the presence of thermodynamic gas hydrate inhibitors on the hydrate formation phase boundary are presented. This work is relevant to flow assurance production development and management of gas hydrate formation at the Keta basin of Ghana.
1.1. Overview of Gas Hydrate Formation
Gas hydrate is the trapping of gas molecules by hydrogen bonded water molecules at low temperature and high pressure condition [2]. Gas hydrates contain about 85 mol% of water cage-like molecules and are commonly formed in three different types of structures; cubic structure I (sI), cubic structure II (sII) and hexagonal structure H (sH) as shown in Fig. (1). Gases such as CH4 and CO2 mostly form sI hydrates while natural gas forms sII hydrates [3, 4]. Hydrates only form when water is combined with certain small molecules called “hydrate formers”. Among the common components in natural gas, methane, ethane, propane, isobutane, nitrogen, hydrogen sulphide, and carbon dioxide are all hydrate formers [5].
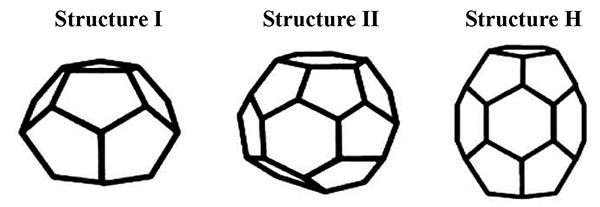 |
Fig. (1). Common gas hydrate crystal structures [6]. |
Gas hydrates have significant applications, as they are known as potential energy source that will replace fossil fuel [7]. In addition, they can be applied in other areas such as, gas storage and transportation [8, 9], sea water desalination [10] and CO2 capture and sequestration [11]. On the other hand, gas hydrate causes a lot of flow assurance problems. This includes; reduction of the internal diameter of tubular, flow restriction, increased surface roughness, increased pumping pressure, reduced throughput, operational and safety problems, plugged surface flow lines, plugged tubing, production downtime, wear and tear of production tubing. All these problems may result in production losses, production shut downs and possible irreparable damage and hazardous conditions. In extensive cases, the plugged line will be abandoned or replaced [12].
Prior to hydrate prevention, the knowledge and understanding of the nature of hydrate formation are critical to making the choices of design modification, initial prevention or neutralisation operations since gas hydrate formation condition is unique to every reservoir fluid composition. The basic conditions for hydrate formation are low temperature and high pressure [12, 13], which implies that, hydrates can only form at field operation temperatures lower than the equilibrium temperature and simultaneously at pressures higher than the equilibrium pressure of the reservoir fluid [14].
One most critical operation in oil and gas flow assurance is the prediction of the hydrate conditions at which gas hydrates will form in production pipelines and facilities. According to Sloan and Koh [14], methods such as hand-calculation, empirical correlations, experimental and computer simulation method are available for predicting the gas hydrate formation conditions in oil and gas production pipelines and facilities. The hand-calculation is basically accurate for single gas system and has limited applicability, the empirical model (mostly based on the van der Waals-Platteew model) mostly face challenges in mixed gas predictions. Experimental method is the best but it’s much time consuming, costly, and needs very high precision and readily accessible apparatus. Therefore, computer simulation software, such as PVTSim, HYSYS etc. are mostly used by companies and researchers since they are less time consuming, very accurate and reliable and easily accessible [14]. In recent times, hydrate models based on Artificial Neural Network (ANN) are proposed [15].
Generally, just as most (such as Parrish-Pransnitz model and the Du-Guo model) natural gas hydrate formation, thermodynamic conditions are developed from the van der Waals’ and Platteeuw model. Herath et al. [16] proposed a Shortest Path of Hydrate Formation (SPHF) prediction method for predicting hydrate formation probability in a subsea production and transportation system, which is not based on van der Waals’ and Platteeuw model.
Currently water removal, depressurisation, heating and chemical inhibition are the available methods to prevent hydrate formation, but chemical inhibition is currently used since it is economical and practically applicable than the other methods. Thermodynamic Hydrate Inhibitors (THIs) such as alcohols and glycols are injected to change the hydrate formation conditions of the hydrate free zone. THIs shift hydrate phase boundary to a lower temperature and higher pressure by reducing the water activity, allowing the actual field operations outside Hydrate Stability Zone (HSZ) to have suffiecient inhibition. The type and amount of inhibitor needed to prevent hydrate is important in every production flow assurance sector for economic and environmental reasons. THI are added at relatively high concentrations of about 10 wt% - 60 wt% in the acqueous phase. Methanol and glycols are still actively used in the industry for hydrate mitigation [17, 18].
There are several reported experimental and simulation studies on natural hydrates mitigation on different oil and gas fields in the world. For example in areas like China [19, 20], India (Krishna-Godavari basin) [21], Canada (Alberta gas field) [22], Norway [23] etc. However, none has been reported on the Keta basin of Ghana.
Recently, Kim et al., [24] experimentally studied the inhibition effect of monoethylene glycol and NaCl solutions of natural gas (90.0 mol% CH4, 6.0 mol% C2H6, 3.0 mol% C3H8, and 1.0 mol% n-C4H10) hydrate formation. The experimental results were modelled using CSMGem. They suggested that, NaCl synergically increases the inhibition impact of MEG in an under-inhibition condition. Huang [20] reported the effect of CH4, N2, CO2 and condensate oil C6+ on hydrate formation conditions of wet-gases compositions from an offshore area in China. The study revealed that, the increase in CH4 content lowered the hydrate formation temperatures of the wet-gases under the same pressure while the presence of condensate oil C6+ showed inhibiting characteristic. However, N2 and CO2 showed negligible effect on the wet-gases systems. According to an experimental study by Lee and Kang [25] on natural gas hydrate of systems containing CH4, C2H6, C3H8, CO2 or H2S in the presence of MeOH, MeOH inhibited all studied systems but varied based on phase behaviour of each system due to different compositions. The inhibition of MeOH was least in the presence of H2S as it expanded the hydrate forming zone. Furthermore, Obanijesu et al. [26] studied that the presence of H2 and N2 in a natural gas could inhibit hydrate formation due to the pressure conditions for hydrate formation, with H2 showing higher significant effect than N2. Rajnauth et al. [27] evaluated the effect of temperature, pressure, impurities (CO2, H2S and N2) and water on gas hydrate formation of 21 natural gas systems using PVTSim. The study suggested that, CO2 and H2S decrease the pressure/temperature equilibrium while nitrogen increases it. Prior to the study, a PVTSim sensitivity analysis was performed to validate the theoretical model and ensure reliable predictions. Ward et al. [28] studied the hydrate equilibrium phase of H2S experimentally and validated his work using PVTSim and reported that, PVTSim could be accurately used for H2S hydrate equilibrium phase studies. In addition, Sule and Rahman [29] predicted the hydrate equilibrium phase of natural gas in the presence of H2S and inhibitor (methanol) using PVTSim. Their results suggested that PVTSim gives accurate prediction. More so, the presence of H2S increased the hydrate formation threat in the studied natural gas systems. However, as mentioned earlier, hydrate formation treats are composition dependent. Thus, the hydrate phase behaviour for every reservoir fluid composition is needed to a successful field operation. Therefore, it is promising to perform such studies on the natural gas composition of the Keta basin of Ghana to help overcome field operational natural gas hydrate formation challenges.
2. MATERIALS AND METHODS
Table 1 shows the synthetic natural gas system of Keta basin and the experimental natural gas system taken from literature [30]. The data obtained from literature were used to validate the accuracy of PVTSim. PVTsim software package version 21 developed by Calsep was used for all the natural gas hydrate equilibrium phase predictions in this work. PVTSim is widely used to predict and simulate fluid properties as a function of temperature, pressure, volume, and composition using cubic Equations of State (EOS) [31].
In PVTSim, the natural gas hydrate phase condition predictions are modelled as proposed by Munck et al. [32], which is derived from the van der Waals’ and Platteeuw model and adapts the Langmuir adsorption theory for determining natural gas molecule occupying a cavity in the hydrate structure. The modified Peng-Robinson (PR) equation of state with the Peneloux volume correction parameter is used by PVTSim to calculate the fugacity parameter in the Langmuir equation.
| Gas | Synthetic Keta Natural Gas System | Natural Gas System (ref [30]) | |
|---|---|---|---|
|
Composition (mol %) |
Composition (mol %) |
||
| N2 | 1.016 | 0.04 | |
| CO2 | 0.853 | - | |
| H2S | 1.191 | - | |
| C1 | 59.339 | 89.86 | |
| C2 | 6.752 | 6.40 | |
| C3 | 7.768 | 2.71 | |
| iC4 | 1.659 | 0.48 | |
| nC4 | 4.077 | 0.49 | |
| iC5 | 2.032 | - | |
| nC5 | 2.324 | 0.02 | |
| C6 | 1.437 | - | |
| C7 | 2.266 | - | |
| C8 | 3.177 | - | |
| C9 | 3.154 | - | |
| C10 | 2.955 | - | |
| Total | 100 | 100 | |
The simulation was done by inputting each natural gas system in Table 1 into PVTSim and the hydrate phase conditions data was predicted using Peng-Robinson (P-R) equation of state. The hydrate phase boundary pressures and temperatures in the range of study (43.09 bar - 350 bar and 12.87 - 27.29 °C) were generated in the PVTSim and plotted in a P-T graph for each natural gas system for analysis. These pressures and temperatures conditions were selected to cover a wide range of normal industrial operational conditions. In order to study the effect of changes in N2 and H2S on the hydrate phase boundary of the Keta natural gas system, the N2 and H2S composition was increased by 5 mol% and 10 mol% and their respectively hydrate phase boundary pressures and temperatures were generated. N2 and H2S were selected, as they are generally considered as impurities in natural gas streams, and since their compositions in Table 1 are slightly above 1 mol%, it’s appropriate to study their possible compositional increasing effect on the Keta natural gas composition. Furthermore, the effect of four commonly used thermodynamic gas hydrate inhibitors; namely, methanol, ethanol, diethylene glycol and monoethylene glycol were studied on the Keta natural gas composition at a concentration of 10 wt%. The studied concentration (10 wt%) was chosen as it falls within the normal range industry inhibitor application as reported by Yussof et al. [33] as 24 wt%.
3. RESULTS AND DISCUSSION
In order to validate the accuracy of PVTSim, the experimental hydrate equilibrium point of the natural gas system [30], as shown in Table 1 was predicted in PVTSim and compared accordingly. From Fig. (2), the PVTSim predicted data agreed with the experimental data with an Average Absolute Error (AAE) of 0.5. This validates the accuracy of PVTSim in simulating the hydrate equilibrium phase of the synthetic natural gas composition of Keta basin.
3.1. PVTSim Hydrate Equilibrium Phase Predictions
The PVTSim predicted hydrate equilibrium phase boundary curve of the synthetic natural gas reservoir fluid of Keta basin is shown in Fig. (3). From Fig. (3), pipeline and facilities operating pressures and temperatures to the right-hand side suggest hydrate free field operations while to the left-hand side of the curve suggests hydrate formation threats in field operations.
3.2. Effect of N2 and H2S Composition on the Hydrate Equilibrium Phase Boundary
Natural gas consists primarily of methane, however, depending on the field location and production life of the field, impurities such as N2 and acids gas (CO2 and H2S) may be present or may have their composition increased. In such cases the hydrate phase boundary of the new composition is necessary for safe operations and/or mitigation of hydrate threat since changes in natural gas composition affects hydrate equilibrium curve phase. Fig. (4) shows the effect of increasing N2 composition at 5 mol% and 10 mol% on the Keta synthetic natural gas system. From Fig. (4), the addition of 5 mol% of N2 showed negligible effect on the hydrate equilibrium curve. However, the addition of 10 mol% of N2 caused the curve to shift slightly to high pressures and low temperatures region, thereby reducing gas hydrate formation threat in the system. This phenomenon according to Sloan and Koh [14], is because less N2 is involve in cage occupancy since N2 requires very higher pressures and low temperatures to form hydrates [34].
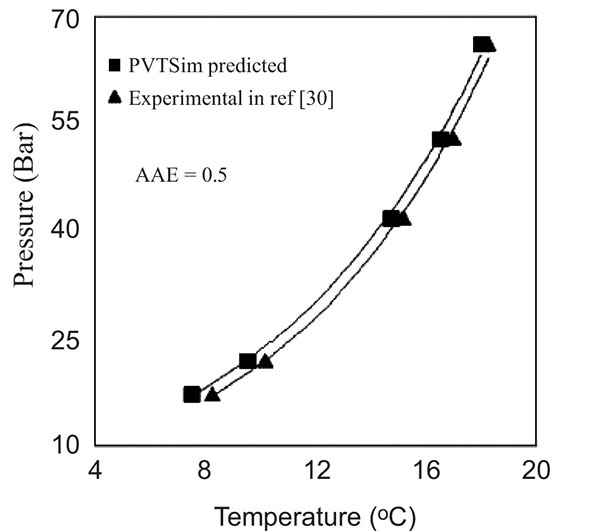 |
Fig. (2). Experimental and PVTSim predicted hydrate equilibrium phase boundary of natural Gas system [30]. |
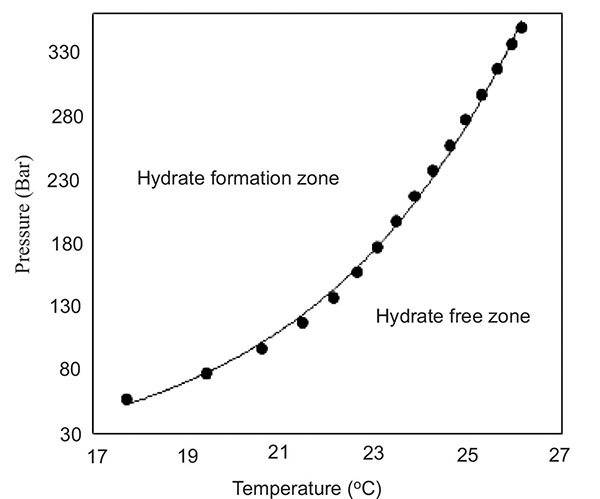 |
Fig. (3). Hydrate equilibrium phase boundary of synthetic natural gas composition of the Keta basin. |
H2S is an acidic gas which changes natural gas composition into sour gas. It is highly soluble in water and forms hydrates at the lowest pressure and persist to the highest temperatures [5]. According to Carroll [5], sour gas more readily forms a hydrate than sweet gas. From Fig. (5), the addition of 5 mol% of H2S shifted the curve to a high temperature and low pressure regions increasing hydrate formation threat in the system. A further shift to the right-hand side (more hydrate formation threat) was observed after adding 10 mol% of H2S. This occurrence agreed with the findings of Sule and Raman [29] who suggested that the presence of H2S increases hydrate equilibrium phase boundary curve. Lee and Kang [25] experimentally studied the hydrate equilibrium curve behaviour of mixed CH4 and C2H4 hydrates and reported that, the mixed CH4 and C2H4 gas hydrate equilibrium curve occurs between the hydrate equilibrium curve of pure CH4 and pure C2H4. They observed that, the increase of a particular gas composition in the mixed gas composition shifted the mixed gas hydrate equilibrium curve closer to the pure hydrate equilibrium curve of that gas. Furthermore, the gas which formed hydrates at milder conditions formed more hydrate through stable cage occupancy and affected the mixed gas equilibrium curve the most. This explains the behavioural effect observed on the hydrate phase equilibrium boundary of the synthetic Keta natural gas system with increasing N2 and H2S composition. Therefore, since H2S forms hydrate at milder conditions, addition of H2S caused an increase in H2S composition of the synthetic Keta natural gas system, therefore, leading to more stable H2S cavity occupation which shifted the curve closer to pure H2S hydrate equilibrium curve.
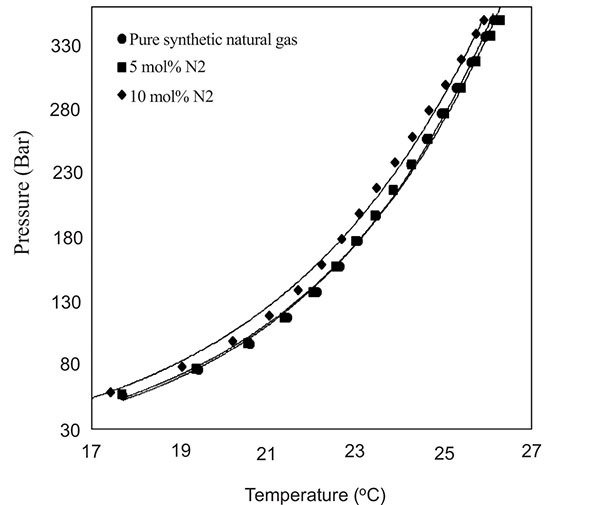 |
Fig. (4). Effects of N2 on hydrate equilibrium phase boundary of synthetic natural gas composition of the Keta basin. |
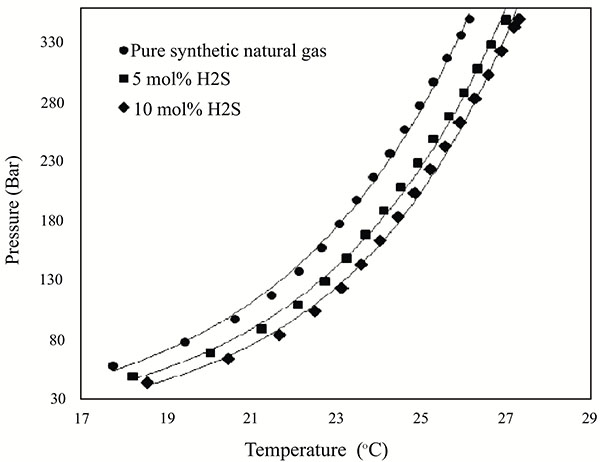 |
Fig. (5). Effects of H2S on hydrate equilibrium phase boundary of synthetic natural gas composition of the Keta basin. |
3.3. Effect of Inhibitors on the Hydrate Equilibrium Phase Boundary
The effect of commonly used oil and gas industry thermodynamic gas hydrate inhibitors namely; methanol, ethanol, monoethylene glycol and diethylene glycol on the synthetic natural gas system of Keta basin were studied and presented in Fig. (6). All the gas hydrate inhibitors used in the study reduced hydrate formation threat in the system at 10 wt% by shifting the hydrate equilibrium curve to high pressures and lower temperatures region. Generally, the alcohol based inhibitors showed high inhibition than glycol based, with methanol showing the highest inhibition impact. The increasing order of inhibition impact of studied inhibitors is; diethylene glycol < monoethylene glycol < ethanol < methanol. This implies that, among all the inhibitors used in this work, methanol is the best thermodynamic gas hydrate inhibitor, to inhibit gas hydrate formation of the synthetic Keta natural gas composition system.
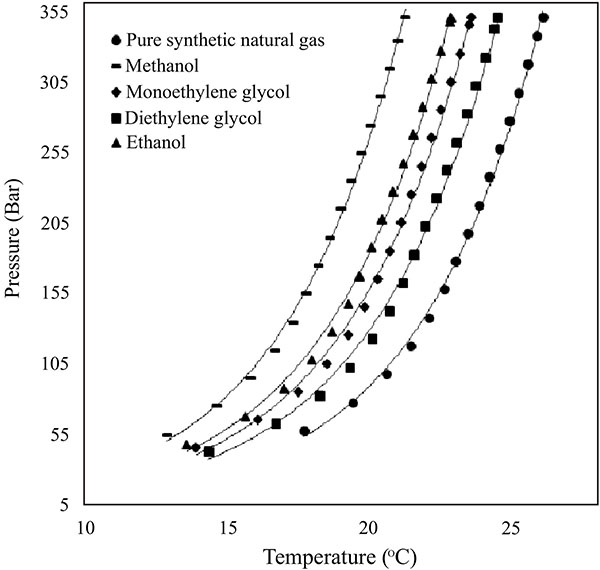 |
Fig. (6). Effects of commonly used inhibitors on hydrate equilibrium phase boundary of synthetic natural gas composition of the Keta basin. |
CONCLUSION
The hydrate equilibrium phase boundary behaviour of a synthetic natural gas composition of Keta basin in Ghana is predicted at pressure and temperature ranges of 43.09 bar - 350 bar and 12.87 °C - 27.29 °C, respectively, using PVTSim version 21. Prior to the simulation the accuracy of PVTSim was validated by predicting the experimental hydrate equilibrium data in open literature with an AAE of 0.5. From the study, the following conclusions can be drawn:
- The addition of 5 mol% of N2 has negligible effect on the hydrate phase equilibrium curve of the synthetic natural gas, but a further increase of N2 composition to 10 mol% slightly reduces hydrate formation threat in the system.
- The addition of H2S increases gas hydrate formation threat in the system with increasing H2S concentration.
- The magnitude of increasing inhibition of commonly used industrial thermodynamic gas hydrate inhibitors was in the order of diethylene glycol < monoethylene glycol < ethanol < methanol. This implies that, among all studied inhibitors in this work, methanol is the best thermodynamic gas hydrate inhibitor, to inhibit gas hydrate formation of the synthetic Keta natural gas composition system.
The finding in this work is relevant in ensuring hydrate free operation in the development and production of oil and gas at the Keta basin of Ghana.
CONFLICT OF INTEREST
The authors confirm that this article content has no conflict of interest.
ACKNOWLEDGEMENTS
The authors are very grateful to the Petroleum Engineering Department of University of Mines and Technology (UMaT), Tarkwa, Ghana for supporting this research.


